[TTM] ICT Key Levels🌟 Overview 🌟
This tool highlights key price levels, such as highs, lows, and session opens, that can influence market moves. Based on ICT concepts, these levels help traders spot potential areas for market reversals or trend continuations.
🌟 Key Levels 🌟
🔹 Week Open (00:00 EST)
Marks the start of the trading week. This level helps track price direction and is useful for framing the Weekly candle formation using ICT’s Power of 3.
🔹 Midnight Open (00:00 EST)
The Midnight Open (MNOP) marks the start of the new trading day. Price often retraces to this level for liquidity grabs, setting up larger moves in the daily trend. It's also key for framing the Daily Power of 3 and spotting possible market manipulation.
🔹 New York Stock Exchange Open (09:30 EST)
The NYSE Open is a major liquidity event, where price seeks liquidity from earlier in the day, like stop hunts or retracements to the London or Midnight Open. This time often brings reversals or trend continuations as volatility increases.
🔹 Previous Day High/Low
These levels show where liquidity rests, often serving as targets for price revisits, ideal for reversals or continuation trades.
🔹 Previous Week High/Low
Similar to daily levels but on a larger scale. They help identify swing trades and track broader market trends.
🔹 Previous Month High/Low
These monthly levels are important for long-term traders, as price often aims to clear them before setting new trends or market cycles.
Happy Trading!
TheTickMagnet
Cari dalam skrip untuk "key levels"

Bjorgum Key Levels
Key Levels Aims to capture 3 of the most significant points in price action
Breakouts
False Breakouts (Traps)
Back Checks
These 3 points alone, if properly identified, can be some of the most significant points of movement in the price history of an asset and bring significant gains to traders, if capitalized on. Here are a few examples of these setups
Breakouts
Breakouts can bring significant rallies as the market swings one sided after key levels are breached. This entry type can bring large trending runs to follow. Momentum is on your side, but the trade off is a higher entry.
False Breakouts
Also known as a bull trap or a bear trap, false breaks can lead to swift and significant reversals and potential for a large and sudden move to the opposite side. When a key level breakout fails to hold, parties entering to capitalize on the "epic breakout" can get left holding the bag forcing them to exit at a loss, which can double the force of pressure. Traps can bring swift gains from good entry prices. However, price is still in a larger trend against you so momentum is weak, so price action is susceptible to roll over.
Backchecks
Back checks are pull backs in trend that find middle ground to the 2 areas already described. Both momentum and entry price are decent, but risk is defined as a key level has flipped offering entry with stops below demand, or above supply.
Combining these 3 methods helps to diversify risk, understand trend development, and bring steady gains. This script helps to identify these points to traders with analysis of key levels, price structure, and trend direction, while providing visual signals and alerts for when they occur.
Best of luck in your coding and trading and thank you for your support

SPY Key LevelsUse Case
Do you belong to a group of traders that post key levels based on their technical analysis to be utilized for trading opportunities? The goal of this indicator is to reduce your daily prep time by allowing you to paste in the actual level values instead of trying to manually create each of the horizontal lines.
How it works
Simply enter the values of the key levels that you would like to plot horizontal lines for
Settings
You can enable/disable any of the levels
You can change the colors of the levels
You can add Previous Day High and Previous Day Low levels to the chart
Limitations
Currently the levels (besides PDH/PDL) are hardcoded to only display for the SPY security "AMEX:SPY"
// Terms \\
Feel free to use the script, If you do use the script could you please just tag me as I am interested to see how people are using it. Good Luck!

XAU/USD Key levels by PB TradingWorldIndicator: XAU/USD Key Levels by PB TradingWorld
Version: 1.0
This is a Trading note for XAU/USD Traders. PB believes that Market Makers will try to protect the Key levels on chart, especially those around Swing High and Swing Low. Therefore, the indicator will show where the noticeable prices. It is displayed as follows:
Key Levels (Round Numbers):
H4 candle = 1 Trading Session
D1 candle = 1 Trading Day
W1 candle = 1 Trading Week
MN1 Canlde = 1 Trading Month
D2 Candle = The last 2 Trading Days
D3 Canlde = The last 3 Trading Days
FOREXCOM:XAUUSD

MTF Key Levels [Mxwll]Mxwll MTF S/R:
The Mxwll MTF Support & Resistance indicator is designed to identify crucial support and resistance levels across multiple timeframes. By considering various timeframes, this indicator provides a more comprehensive view of the market's underlying structure. It allows traders to extend lines in various configurations and covers timeframes ranging from 5 minutes to weekly. By considering price action across multiple timeframes, the indicator provides a more comprehensive understanding of the market's supply and demand dynamics. Traders can use the Mxwll MTF Support & Resistance Indicator to refine their trade entries and exits, manage risk, and establish potential price targets.
FEATURES
5 Minute to Weekly Key Levels
Accurate Multi-Timeframe Support and Resistance
Customize To Extend The Lines - Left, Right and Right Across The Chart
Interplay Between Support and Resistance Levels
Change Colours Of S&R
Change Colours Of S&R Lines
INSTRUCTIONS
Select Your Timeframe -> Unselect the S&R Levels That Are Less Than The Timeframe - Trade

Reverse Engineered RSI - Key Levels + MTFThis indicator overlays 5 Reverse Engineered RSI (RERSI) levels on your main chart window.
The RERSI was first developed by Giorgos Siligardos in the June 2003 issue of Stocks and Commodities Magazine. HPotter provided the initial implementation - from which this script is derived - so all credit to them (see: ).
In simple terms, RERSI plots lines on the price chart that reflect levels of the RSI . E.g. if you set up a RERSI line at a level of 50, then price will touch that line when the standard RSI indicator reads 50. Hopefully that makes sense, but compare the two if it doesn't.
Why is the RERSI useful if it's just plotting RSI values? Well, it simplifies things, and enables you to get a clearer picture of trend direction, RSI support and resistance levels, RSI trading signals, and it keeps your chart window uncluttered.
I've set up 5 RERSI lines to be plotted: Overbought and Oversold Levels, a Middle Level (generally leave this at 50), and then Down/Up Trend Lines. The latter two are loosely based on the work of Constance Brown (and they in turn were influenced by Andrew Brown), who posited that RSI doesn't breach certain levels during trends (e.g. 40-50 is often a support level during an uptrend).
Play around with the levels, and the RSI Length, to see how your particular market reacts, and where key levels may lie. Remember, this isn't meant as a stand-alone system (although I think there's potential to use it as such, especially with price action trading - which I guess wouldn't make it stand-alone then!!), and works best with confirmation from other sources.
Oh, and there's MTF capability, because I think that's useful for all indicators.
Any queries, please let me know.
Cheers,
RJR

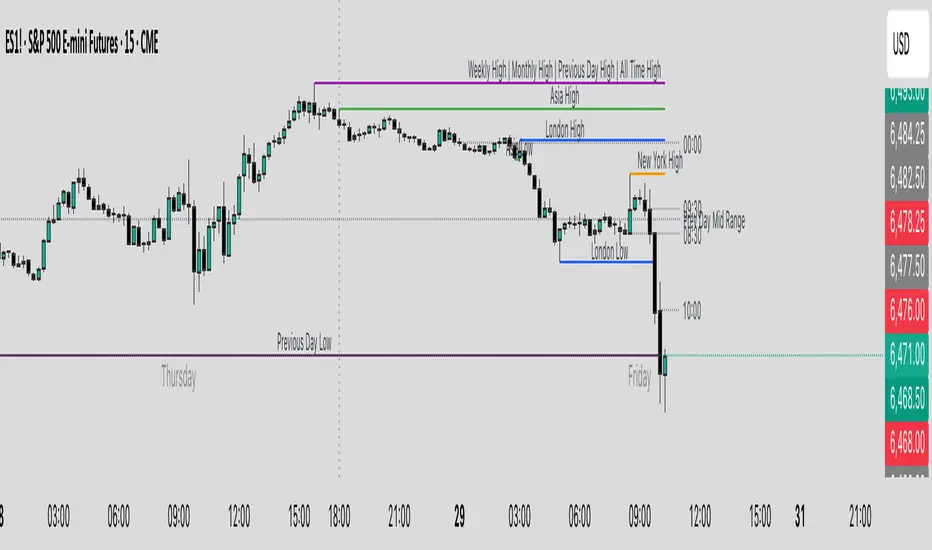
Nikkei Session Key Levels Lines (with Labels) - Nikkei CFDThis is Nikkei Session Key Levels Lines (with Labels) - Nikkei CFD. shows you all the key level lines that you need to be aware. hope it helps :)

NSDT Daily Key LevelsSimple script to show key levels of current day and previous day. Labels can be turned on and off as needed. Line colors, thickness and style can be changed. Modified the "M/W/D Level" script from paaax. Credit for original code goes to him. Link to script and profile posted in code of this script.

Daily Gold Key Levels from X (Intraday - Unified Text Box)Script pulling daily trade ideas and key levels from X Accounts for XAU USD

DT Key LevelsThis indicator provides you with key levels and pivot points.
Asia high
Asia low
Asia EQ
Daily pivot
PDH
PDL
PWH
PWL
EQ
Resistance level 1,2 & 3
Support level 1,2 & 3

MTF Alignment & Key Levelsso this one is specifically for the 1hr and 4hr time frame. but what it does is alert you once the monthly weekly and daily timeframes align with a trend in a certain direction wether its bearish or bullish but then it will mark out key levels on the 1hr and 4hr time frame to indicate when price breaks through that level to enter a trade in the direction of the higher timeframes alignment.

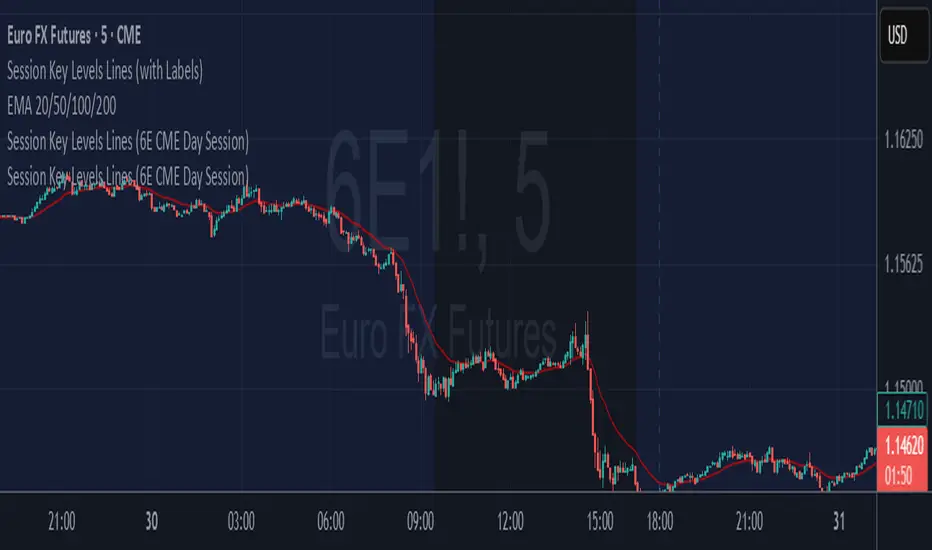
6E update Session Key Levels Lines (6E CME Day Session)6E update Session Key Levels Lines (6E CME Day Session) hope it helps :)
GBP-JPY Key LevelsTriple Zero (price.000), Double Zero (price.500) and Five-Zero (price.x50) Key Levels, specifically used for the GBP-JPY pair.

Key Levels: Prior Open & Close (D/W/M/Q/Y)This indicator plots the previous period's open and close levels for multiple timeframes—daily, weekly, monthly, quarterly, and yearly—on your chart. It uses Pine Script's request.security() function to pull the prior period's open and close prices for each timeframe, then draws horizontal dotted lines extending to the right at those levels. Each line is labeled and color-coded for easy distinction. These levels can help highlight potential support/resistance areas, but they are reference points only and not trading signals.

Key Levels: PDH/L, PMH/L, Oopening RangeBasic scrip that shows Previous Day High and Low, and also Pre-Market High Lows, and also the Opening Range. Everything is adjustable.

Key Levels [@treypeng]Draws horizontal lines for Daily, Hourly (1) and Weekly levels. Really handy to switch on quickly when scalping.
Light blue: Previous hour OHLC
Thick light blue: Previous hour Close / current hour Open
Dark blue: Yesterday OHLC
Thick dark blue: Yesterday Close / today Open
Purple: Weekly Open
It's a bit ugly, I'd prefer horizontal rays instead of lines stretching back across the chart but I couldn't figure out how to do this in PineScript. If I get it sorted, I'll publish an update.

Key Levels & Session Highs/Lows by OdegosProfessional multi-timeframe support and resistance level indicator that automatically tracks and displays key price levels across different trading sessions and timeframes.
🎯 What it shows:
Session Open - Daily market open reference line
Asia & London Sessions - High/low levels from major trading sessions
Previous Day - Yesterday's actual high and low levels
Weekly & Monthly - Higher timeframe support/resistance levels
⚡ Smart Features:
Auto-combines overlapping levels with merged labels
Break detection - Lines stop when price breaks through (optional)
Timezone support - Works with any global timezone
Universal colors - Optimized for both light and dark chart themes
Clean interface - Organized settings with intuitive dropdowns
🛠️ Fully Customizable:
Individual show/hide toggles for each level type
Custom colors, line styles, and widths
Adjustable label text and positioning
Global text color override option
Perfect for day traders, swing traders, and anyone who relies on key support/resistance levels for market analysis.
Key Levels (Time Frames - Weekly,Monthly,Quarterly,Yearly)This indicator plots the 4h, Daily, Weekly, Monthly, Quarterly, Yearly Open High, Low and Mids.
You can watch how these institutional trading levels work as support and resistance.
Most Important you can add alerts to these levels with a few clicks.
Just add/remove unnecessary levels for scaling problems.
For any error/suggestion/improvement just let me know.

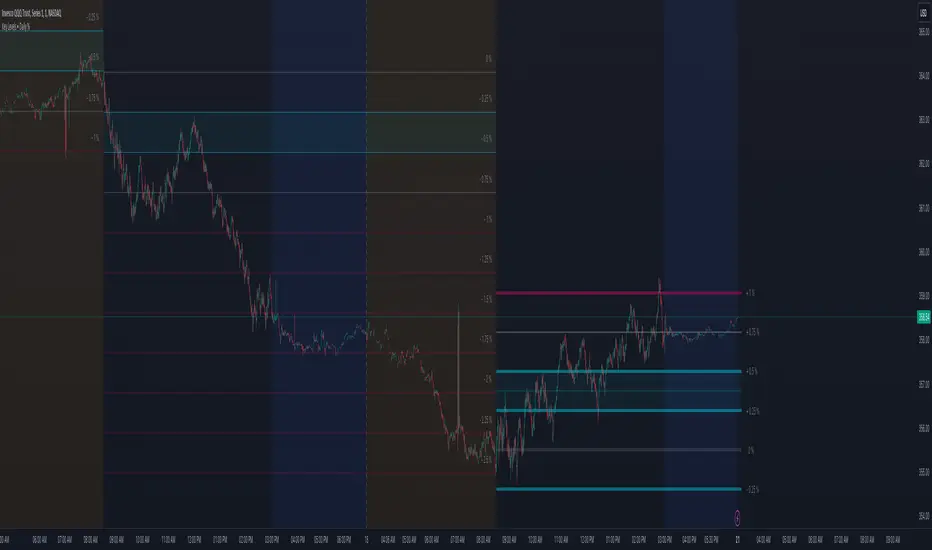
Key Levels (Daily Percentages)OVERVIEW
This indicator automatically identifies and progressively draws daily percentage levels, normalized to the first market bar.
Percentages are one of the most common ways to measure price movement (outside price itself). Being able to visually reference these levels helps contextualize price action, in addition to giving us a glimpse into how algos might "see" the market.
This script is most useful on charts with smaller time frames (1 to 5 minutes). This is not ideal for medium or larger time frames (greater than 5 minutes).
INPUTS
You can configure:
• Line size, style, colors and maximum length
• Label colors and visibility
• Fractional and intra level visibility
• Bidirectional zone parameters (custom range and extended anomalies)
• Normalization source
• Price Proximity features
• Market Hours and Time Zone
INSPIRATION
Broad Assumptions:
• +/- 70% of days move 1%, 20% of days move 1-2%, and 10% of days have moves exceeding 2%.
• +/- 10-20% of days trend, with moves ≥ 1%.
• All trading strategies are effectively scalping, mean reversion, or trend.
• Humans program algos to capitalize on these assumptions, using percentages to mange / execute trades.
Key Levels (Open, Premarket, & Yesterday)not every pee pee time is poo poo time, but every poo poo time is pee pee time

Volume Buy/Sell Pressure with Hot PercentFULL DESCRIPTION (Condensed Version)
Volume Buy/Sell Pressure with Hot Percent
Professional volume analysis indicator revealing real-time buying and selling pressure with hot volume detection and customizable alerts.
Key Features:
Three-Layer Histogram - Visual breakdown: total volume (gray), buying pressure (bright green), selling pressure (bright red)
Flexible Display - Toggle between percentage view or actual volume counts for buying/selling pressure
Real-Time Metrics - Live buying/selling data, current bar volume, daily totals, 30-bar/30-day averages with comma formatting
Hot Volume Detection - Automatic alerts with white triangle markers when volume exceeds threshold
Customizable Labels - 4 sizes (Small/Normal/Large/Huge), 9 positions (all corners/centers/middles), toggle any metric on/off
Smart Color Coding - Green (high volume/buying dominant), Red (selling dominant), Orange (equal pressure), Gray (low volume). Black text on bright backgrounds for maximum contrast.
Alert Conditions:
Hot Volume: Triggers when volume exceeds moving average by specified percentage
Unusual 30-Bar Volume: Current bar significantly above 30-bar average
Unusual 30-Day Volume: Daily volume significantly above 30-day average
Settings:
Display - Toggle metrics, choose percentage/count display, select size and position
Volume - Set unusual volume threshold (default 200%), adjust average length (default 21)
Hot Volume - Choose SMA/EMA, set lookback period (default 20), define threshold (default 100%)
Perfect For:
Day traders scalping futures (MNQ, MES, MYM, MGC, MCL)
Swing traders identifying accumulation/distribution
Breakout traders needing volume confirmation
All timeframes - tick charts to daily/weekly
Use Cases:
Confirm trend strength with pressure alignment
Spot reversals when pressure diverges from price
Validate breakouts with hot volume alerts
Identify smart money through unusual volume
Track institutional activity at key levels
What Makes This Different:
Shows buying vs selling pressure WITHIN each bar using price range methodology. Most indicators only show total volume or simple up/down. This reveals actual pressure distribution regardless of bar direction. Three-layer design makes order flow instantly visible.
Pro Tips:
Use "Large" labels at 100% zoom
Enable volume count display for position sizing
Position labels in corners to avoid price overlap
Enable alerts during pre-market and news events
Watch for divergences: price up + selling pressure up = potential reversal
Compare to both 30-bar and 30-day for full context
Technical:
Pine Script v6
All timeframes and instruments
No repainting
Efficient code, minimal CPU
Three alert conditions
Works on futures, stocks, forex, crypto
Clean, professional presentation. Essential for volume analysis and order flow tracking.
